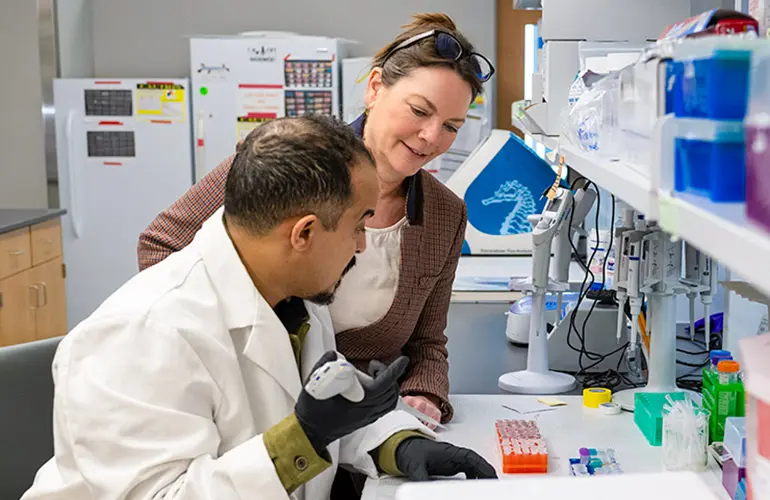
About the College of Pharmacy
Creating transformational leaders in pharmacy
Accreditation
The College of Pharmacy doctor of pharmacy program is fully accredited by the Accreditation Council for Pharmacy Education.
91.1%
First-time NAPLEX pass-rate (national rate 86.8%)
7:1
Student-to-faculty ratio
1,000+
Alumni since 2011
In depth: Pass rates, placement and more
Source: The College of Pharmacy’s Office of Assessment.
| Matriculation Year | 2012 | 2013 | 2014 | 2015 | 2016 | 2017 | 2018 | 2019 | 2020 | |
|---|---|---|---|---|---|---|---|---|---|---|
| Grad Year (if on time) | 2016 | 2017 | 2018 | 2019 | 2020 | 2021 | 2022 | 2023 | 2024 | |
| Matriculating cohort size | n | 74 | 76 | 82 | 75 | 90 | 75 | 94 * | 92 | 90 |
| Graduated in four years | n | 59 | 69 | 69 | 60 | 72 | 60 | 82 | 78 | 74 |
| % | 79.7% | 90.8% | 84.1% | 80.0% | 80.0% | 80.0% | 87.2% | 84.8% | 82.2% | |
| Delayed graduation | n | 7 | 5 | 5 | 7 | 10 | 3 | 9 | 7 | 0 |
| % | 9.5% | 6.6% | 6.1% | 9.3% | 11.1% | 4.0% | 9.6% | 7.6% | 0% | |
| Withdrawal/dismissal | n | 8 | 2 | 8 | 8 | 8 | 12 | 3 | 5 | 6 |
| % | 10.8% | 2.6% | 9.8% | 10.7% | 8.9% | 16.0% | 3.2% | 5.4% | 6.7% | |
| Active student/ leave of absence |
n | 0 | 0 | 0 | 0 | 0 | 0 | 0 | 2 | 10 |
| % | 0% | 0% | 0% | 0% | 0% | 0% | 0% | 2.2% | 11.1% | |
* includes one transfer student
| Category | 5-year average | 2021 | 2022 | 2023 | 2024 | 2025 |
|---|---|---|---|---|---|---|
| NEOMED | 80.3% | 75.4% | 81.3% | 76.3% | 81.5% | 91.1% |
| National | 81.2% | 83.6% | 79.6% | 78.6% | 77.5% | 86.8% |
| Ohio | 83.2% | 85.4% | 81.9% | 85.9% | 82.9% | 93.1% |
| 5-year average | 2020 | 2021 | 2022 | 2023 | 2024 | 2025 | |
|---|---|---|---|---|---|---|---|
| NEOMED | 78% | 87.3% | 77.6% | 68.3% | 71.0% | 86.1% | 82.9% |
| National | 77.5% | 84.6% | 80.3% | 77.1% | 74.4% | 78.4% | 76.7% |
| Ohio | 84.7% | 89.7% | 86.4% | 85.4% | 80.5% | 86.5% | 84.4% |
| Graduation year | 2020 | 2021 | 2022 | 2023 | 2024 |
|---|---|---|---|---|---|
| Number of graduates | 79 | 69 | 87 | 87 | 85 |
| Practicing as a pharmacist or employed in a pharmacy-related field | 86% | 88.4% | 90.8% | 83.9% | 95.3% |
| Not participating in post-graduate training | 44.3% | 58% | 41.3% | 48.3% | 52.9% |
| Participating in post-grad education / training | 39.2% | 27.5% | 48.3% | 34.5% | 41.2% |
| Employed in pharmacy-related field (e.g., industry) | 2.5% | 2.9% | 1.2% | 1.2% | 1.2% |
| Employed in non-pharmacy field | 1.3% | 0% | 0% | 1.2% | 0% |
| Unemployed: Placement being sought | 7.6% | 5.8% | 2.3% | 2.3% | 0% |
| Not seeking employment | 2.5% | 2.9% | 2.3% | 2.3% | 3.5% |
| Lost to follow-up | 2.5% | 2.9% | 4.6% | 10.3% | 1.2% |
* Data collected six to nine months post-graduation
| Class of 2021 | Class of 2022 | Class of 2023 | Class of 2024 | Class of 2025 | |
|---|---|---|---|---|---|
| Placement rate | 67% | 87% | 94% | 89% | 83% |
See statistics around enrollment, admissions, student progression and more.
CONTACT
Office of Assessment
Phone: 330.325.6596
Email: copassessment@380cebbe0d.nxcli.io
OFFICE OF ASSESSMENT
© 2024 Northeast Ohio Medical University
4209 St. Rt. 44, PO Box 95, Rootstown, Ohio 44272
ADA compliance | Consumer information | Title IX | Privacy statement | Do business with NEOMED